
 It’s always good to look at the long-term picture after any housing or financial crisis. The charts below show the median price of homes throughout Riverside County from 1982 to the present and the Riverside County affordability index. The median price and affordability numbers for the county are good proxies for prices and affordability in the Coachella Valley.
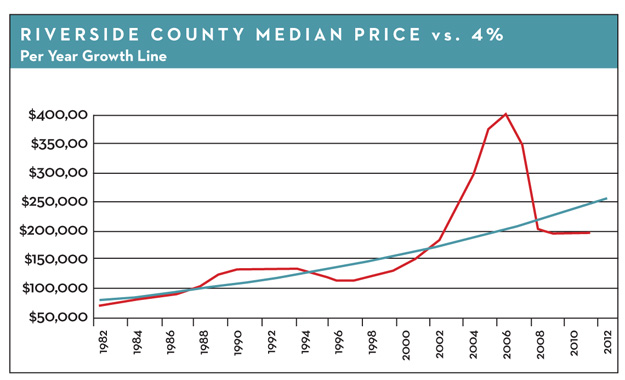
In the price chart, the red line is the median price of homes. The blue line represents a 4 percent per year price gain, which is about the long-term average for homes in California. As you can see, home prices went far above it during the bubble period and then crashed below it, due to the huge glut in foreclosed homes. For two important reasons, we believe prices are ready to return to the average growth line.
The first reason is the affordability index, which measures the number of homeowners who can afford the median-priced home at current mortgage interest rates. The combination of record low rates and record low house prices lifts the afford-ability index to 65 percent, the highest rate on record. Even though unemployment is high, this high affordability index still matters. Eight percent unemployment means 92 percent of the workforce is still working, and 65 percent of that is the largest number of buyers ever qualified by income. This is in contrast to only 14 percent of qualified buyers during the height of the bubble. The affordability index is the best economic indicator for long-term housing. The current number puts a solid floor under housing at the current price.
The long-term price trend projects a median price of $265,000 by the end of next year. Currently, the median price in Riverside County is $212,000. Returning to the norm would be a further 25 percent gain over the next 16 months.
That brings us to the second reason we think this will happen. Twenty-five percent is close to the 21 percent gain we think will occur once distressed sales disappear. By our calculations, distressed sales should fall off markedly by sometime later next year.
Home Inventory and Distressed Sales Continue Decline
Two years ago, distressed sales accounted for 54 percent of all sales. A year ago, it dropped to 48 percent, and it’s now 37 percent. In Palm Springs, Palm Desert, Rancho Mirage, and La Quinta, it’s closer to 25 percent. These are very positive and important changes. However, we are at the point where seasonal factors usually prevail.
The inventory of homes as measured by months of sales has gone through a similar metamorphosis. It has gone from six months of sales two years ago to five months a year ago to only three months now.
Inventory numbers also show seasonal patterns. We expect them to rise from August to December, as they have the past two years. Though the hot season is June to September, because of transaction delays, it shows up in numbers two months later (August to December). It will be important to see how these statistics rise over four months. If they rise less than normal, that could be a harbinger of good things next year.
Vic Cooper and Mike McDonald are partners in Market Watch LLC, a nationally recognized real estate advisory company that produces The Desert Housing Report. Visit www.marketwatchllc.com.

See More Market Watch Articles Here