Housing continues its strong recovery throughout the Coachella Valley. As of Aug. 1, the median price per square foot had risen 23 percent over last year, which is staggering considering that’s only seven months. The corresponding returns for each of the nine cities in the region are all positive with broad distribution around this average.
La Quinta is the strongest city, with a 35 percent year-to-date return, followed by Indio (31 percent), Desert Hot Springs (23 percent), and Cathedral City (18 percent). The cities with the lowest returns are Rancho Mirage (7 percent) and Coachella (4 percent).

Demand Now Exceeds Supply
The factors driving price gains are simple and fundamental: Demand for homes far exceeds supply.
High demand is the result of the Federal Reserve holding mortgage rates at record-low levels using a program called Qualitative Easing. With lower rates, more people than ever qualify to buy homes.
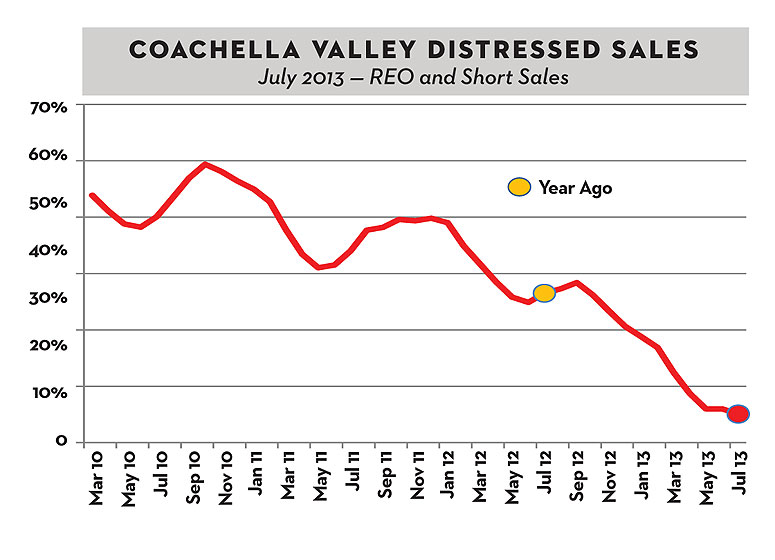
The low supply is a complete reversal from two years ago, when supply — primarily from foreclosures and strategic defaults — was overwhelming. As seen in the chart, foreclosures and short sales accounted for 60 percent of sales two years ago; now it’s down to only 15 percent. With this waning of distress sales, the supply of homes for sale has dropped to a record low.
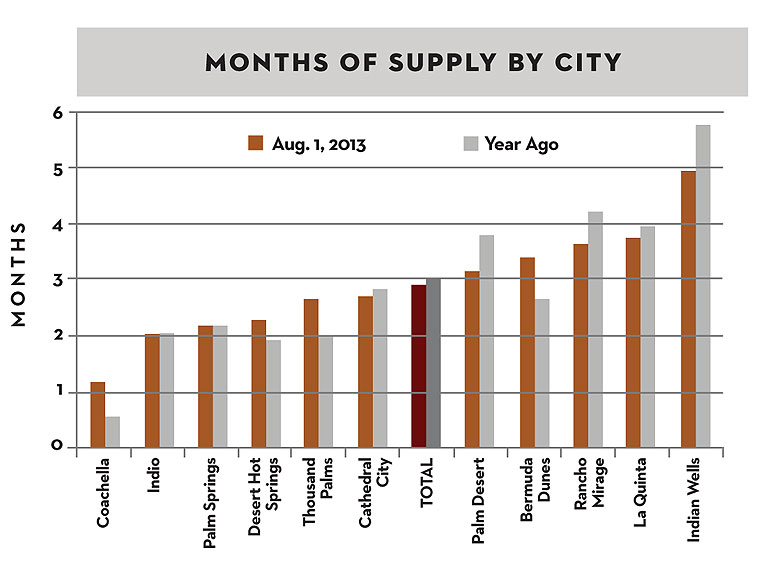
The best way to examine supply is through a metric called “months of supply,” which is calculated by taking the available inventory and dividing it by the monthly sales rate. The result is the number of months it would take to deplete the inventory at the current sales rate. The chart shows the ratio as of Aug. 1 for 11 cities in the Coachella Valley. The blue bar is this August’s ratio; the yellow bar is August of last year.
The two darker-colored “Total” bars in the middle of the graph are the ratio for the entire Coachella Valley. They show the region with about three months of supply. This is historically a low ratio and, as the graph shows, it has been at this level for a year. In contrast, three years ago it was greater than 12 months.
The chart shows that six cities have ratios less than three months, four cities are between three and four months, while Indian Wells is at five months. This indicates the low supply of homes is region-wide.

No Worry From Higher Rates
Many real estate analysts are considerable worried that the Fed will begin to slow the Qualitative Easing program, causing rates to rise and the recovery to choke. In fact, as we write, rates have already started to rise. We think this a false signal, however. With inflation near record lows and slow economic growth, we believe the Fed will keep the program in place.
Vic Cooper and Mike McDonald are partners in Market Watch LLC, a nationally recognized real estate advisory firm that publishes The Desert Housing Report. Visit www.marketwatchllc.com
See More Market Watch Articles Here

